
Software & services
Collect and use industrial data with E2C Factory, bring LoRaWAN devices into your applications with E2C Field, and manage deployed gateways with RCMS.
E2C Factory
Industrial data & SCADA
E2C Factory
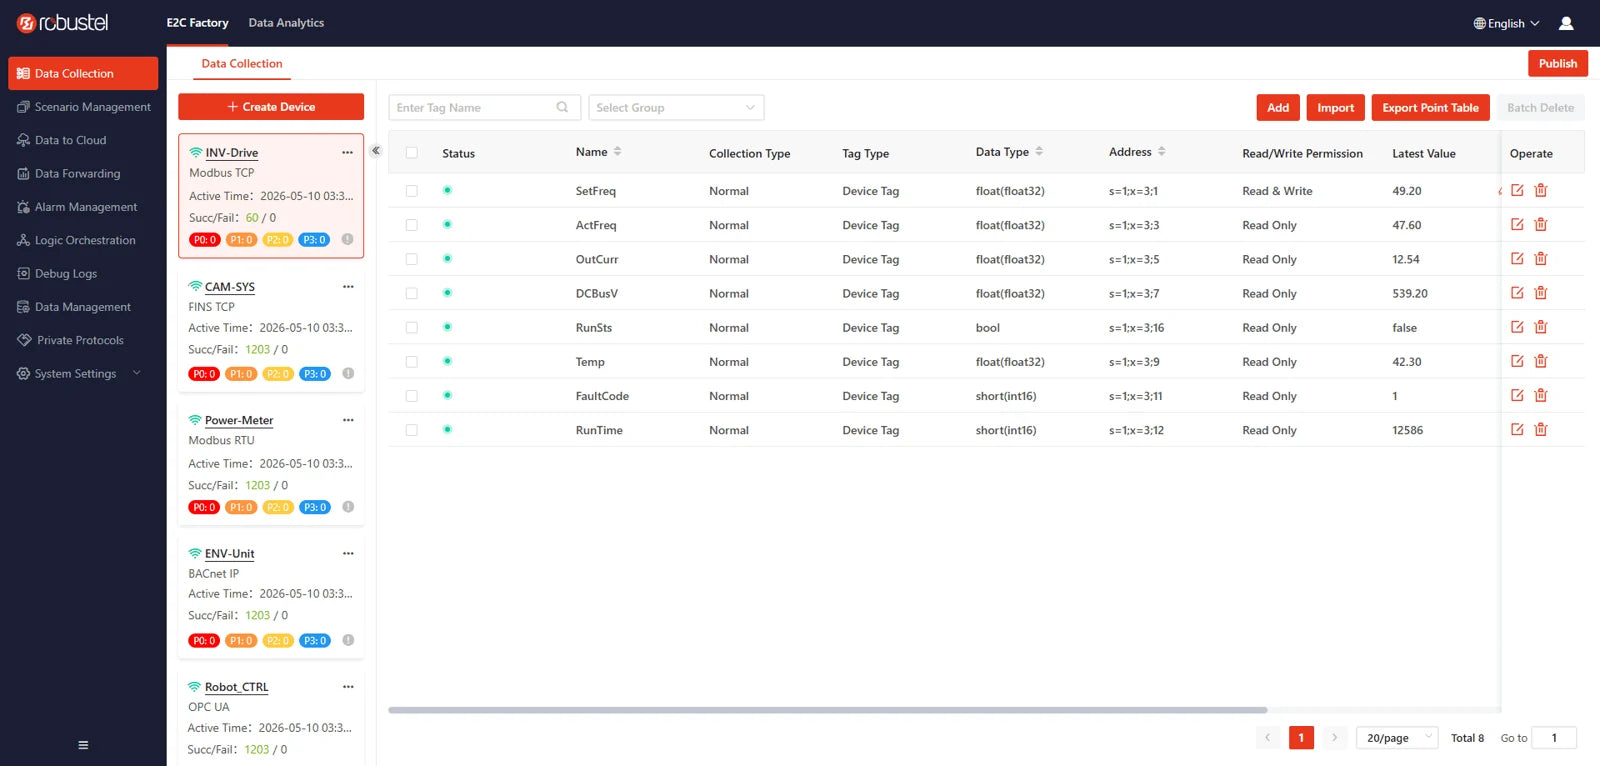
Connect industrial devices and scale the project
Bring compatible PLC and meter values into one tagged data model. The wider E2C Trinity platform supports 100+ industrial protocols; use the Factory driver library to connect supported equipment.
- Modbus RTU/TCP, Siemens S7 and OPC UA drivers.
- Core and Pro editions provide the full Factory protocol library.
- Group tags and check live readings and communication diagnostics.
Local processing, alarms and custom applications
Process readings on the gateway before sharing them with dashboards or other systems. Operators can see values in familiar units, and connected applications can reuse the same calculations.
- Scale a temperature register from raw 235 to 23.5 °C when each count represents 0.1 °C.
- Combine device or tag-group data in Node-RED and save a result to a virtual tag.
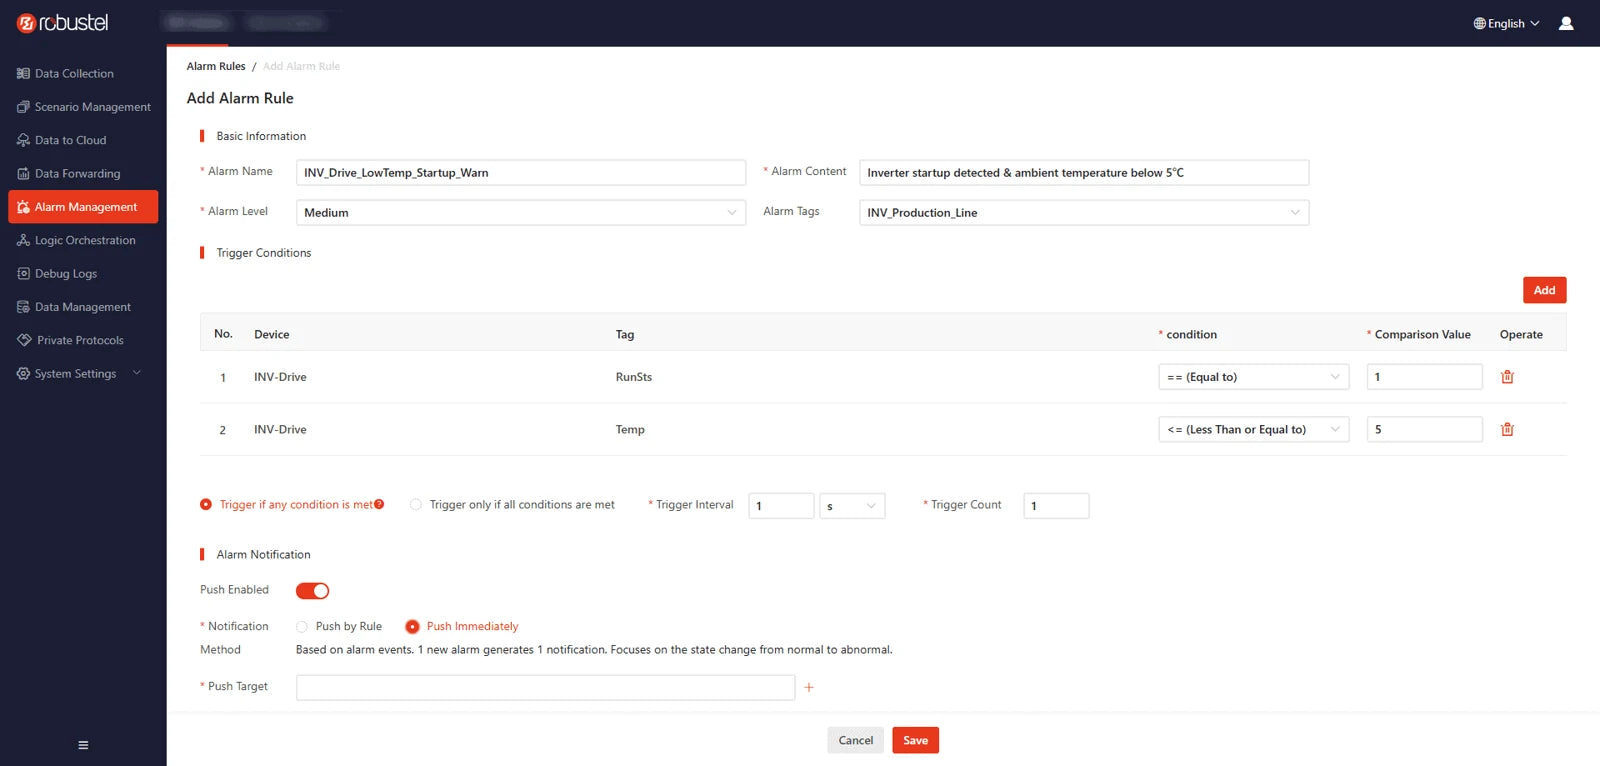
- Evaluate alarm thresholds locally and use a deadband to reduce repeated alerts.
- Run compatible container workloads on a supported RobustOS Pro host.
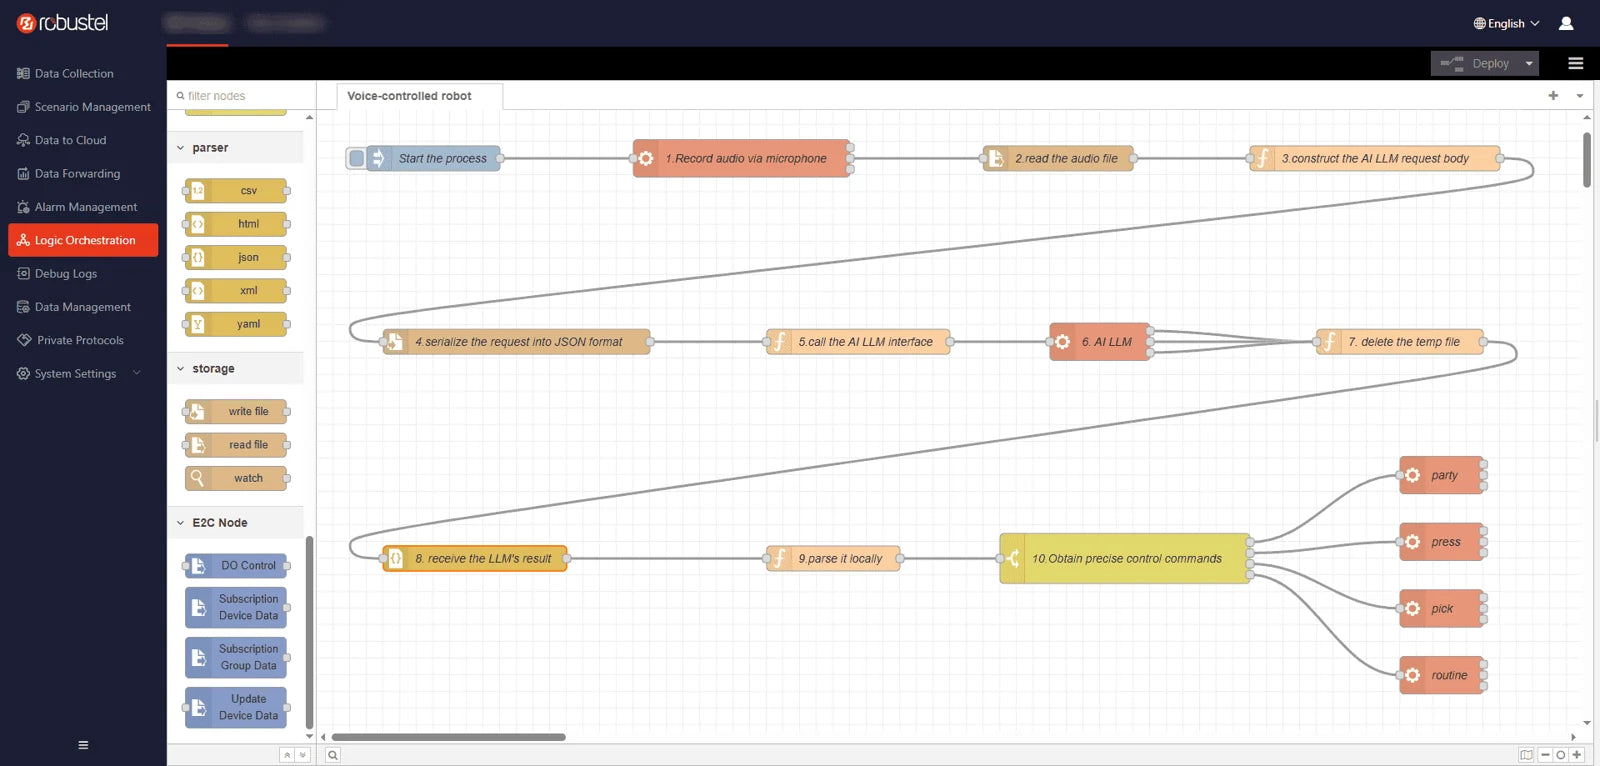
Keep timestamped history through network gaps
Keep timestamped readings in local time-series storage for trends and review. When the MQTT connection drops, a separate outgoing cache can retain pending reports. The gateway resends retained reports when the connection returns.
- Choose which readings to archive with their record times.
- Set the offline cache size and retention period.
- Replay oldest first (FIFO), or prioritise the newest reports.
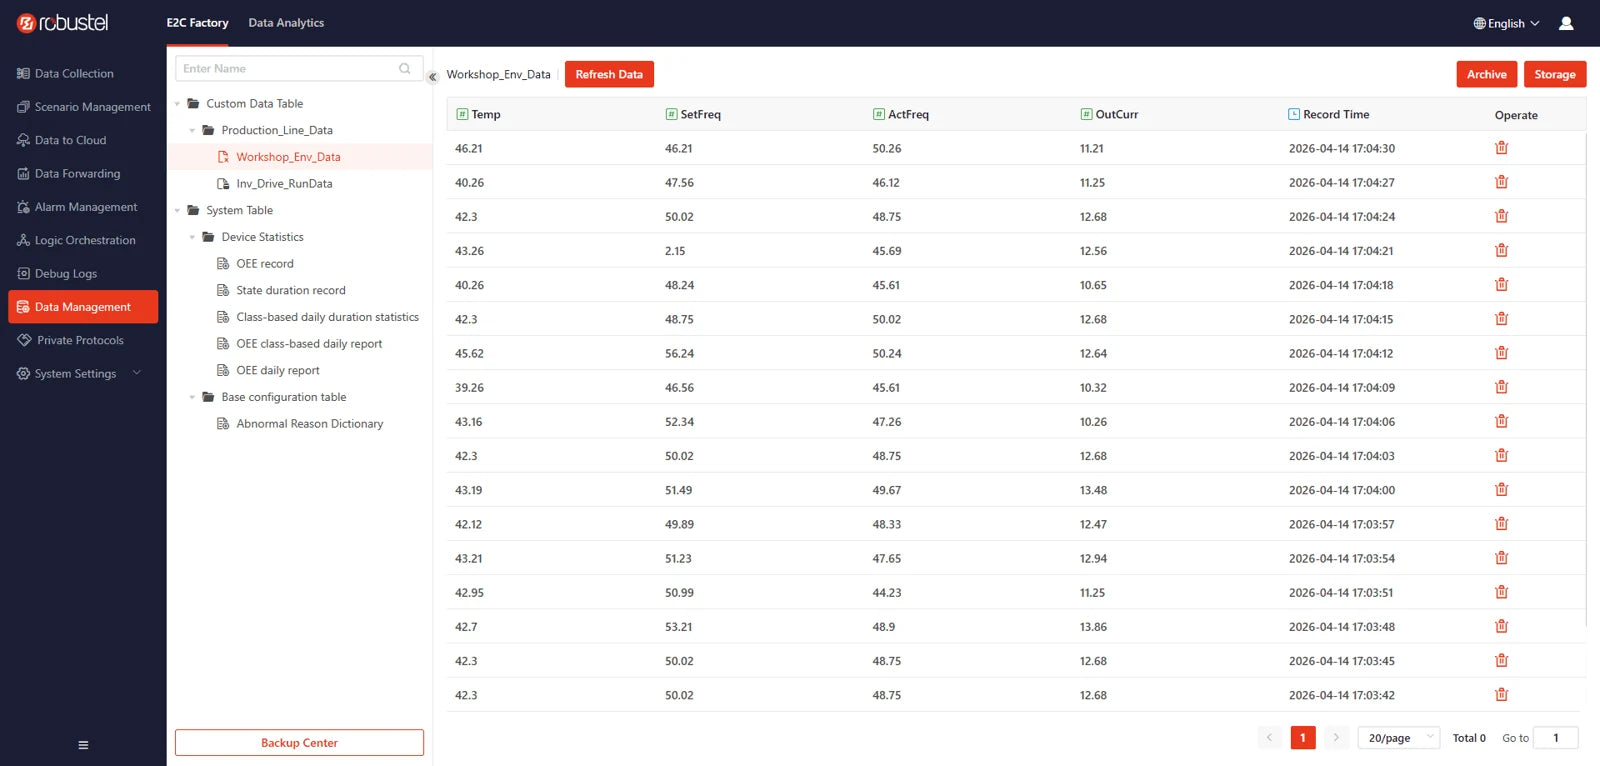
Visualise operations with SCADA and OEE
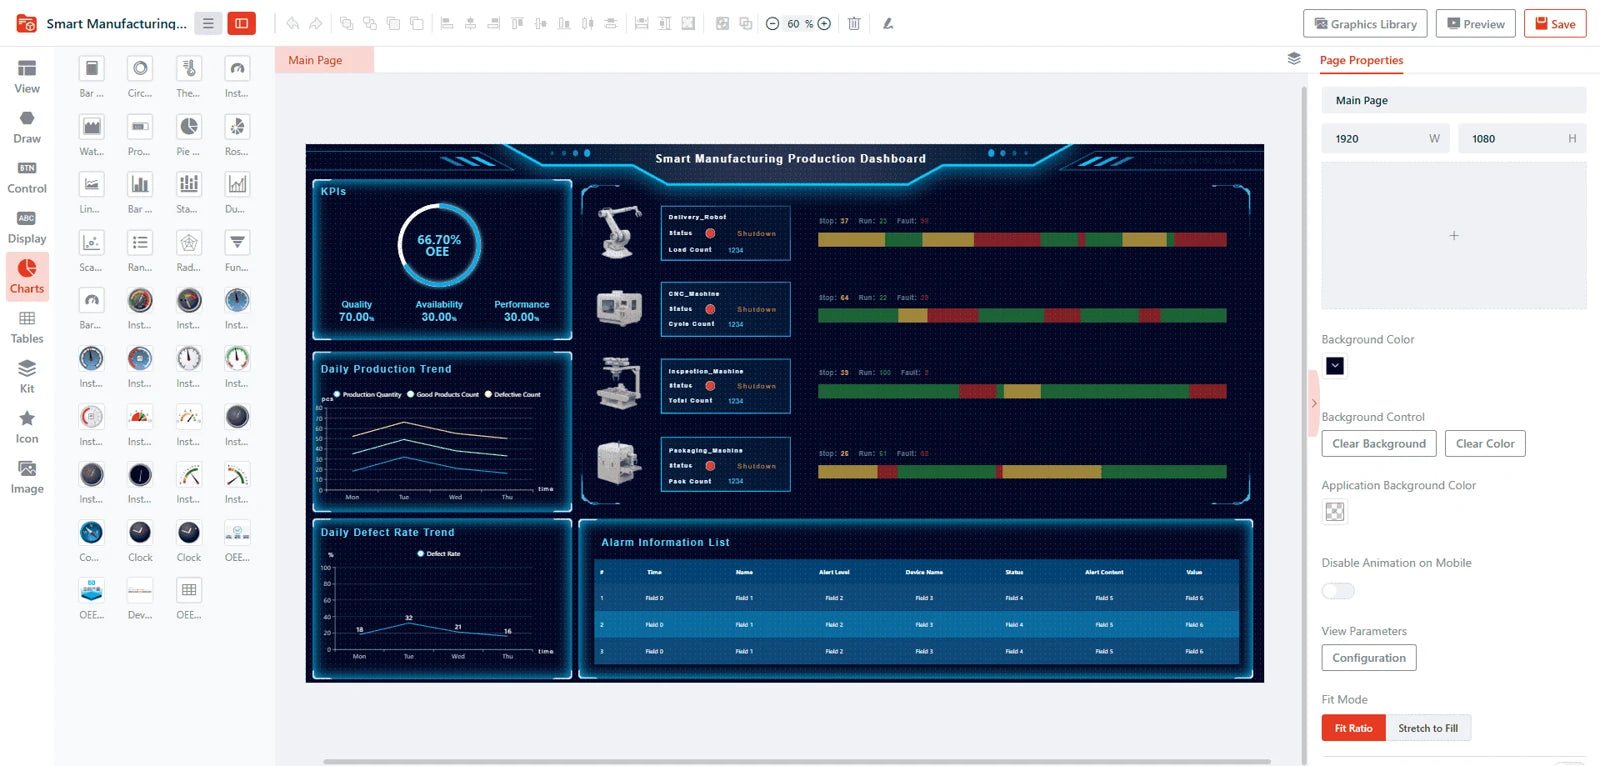
Build local SCADA dashboards for live measurements, status, trends and alarms. Compare archived trends with current equipment state. Factory Pro adds overall equipment effectiveness (OEE) analysis to assess availability, performance and quality.
- Create desktop or mobile views in SCADA Designer.
- Bind SCADA views to measured and calculated tags.
- OEE dashboards and analysis require Factory Pro.
Connect through MQTT, Sparkplug B and industrial servers
Use standard MQTT for selected tag groups, or Sparkplug B for structured metrics and node/device status. Share the same underlying gateway tags with plant systems through industrial protocol servers. Use your own compatible MQTT broker and host.
- MQTT reporting: periodic, on-change or combined.
- Sparkplug B edge-node publishing and lifecycle messages.
- OPC UA, BACnet/IP and Modbus TCP server interfaces.

Turn events into configured supervisory actions
Use a local rule, alarm event, schedule or cloud command to start a configured response. Update permitted tags, run a function or control a gateway digital output. Machine interlocks and safety functions remain in the PLC or safety system.
- Set event conditions, execution order and schedules.
- Apply authorised tag writes and configured DO actions.
- Notify via configured WhatsApp, Telegram, email or SMS.
Capabilities and capacity depend on the edition. Pro features shown are optional paid upgrades.
Factory editions & capacity
- Free
- 18 protocols, up to 200 collection tags and 100 SCADA tags.
- Core · Paid
- Full Factory protocol library. Licences for 200 or 2,000 collection tags; SCADA capacity depends on the selected Core tier, up to 2,000 tags.
- Pro · Paid
- Adds OEE. Available with 2,000 or 5,000 collection tags.
Stable operation at 5,000 tags requires 8 GB RAM. Select the licence and capacity for your installation.
E2C Field
LoRaWAN & field data
E2C Field
Follow a reading from connected devices to local decisions and the systems you use.
Bring sensors and meters onto one gateway.
Connect compatible LoRaWAN sensors through the gateway’s built-in network server. Bring in readings from wired equipment, such as a Modbus meter, so both sources are available to the same application.
- Match the sensor profile and regional channel plan.
- Check live joins and uplinks from your own device.
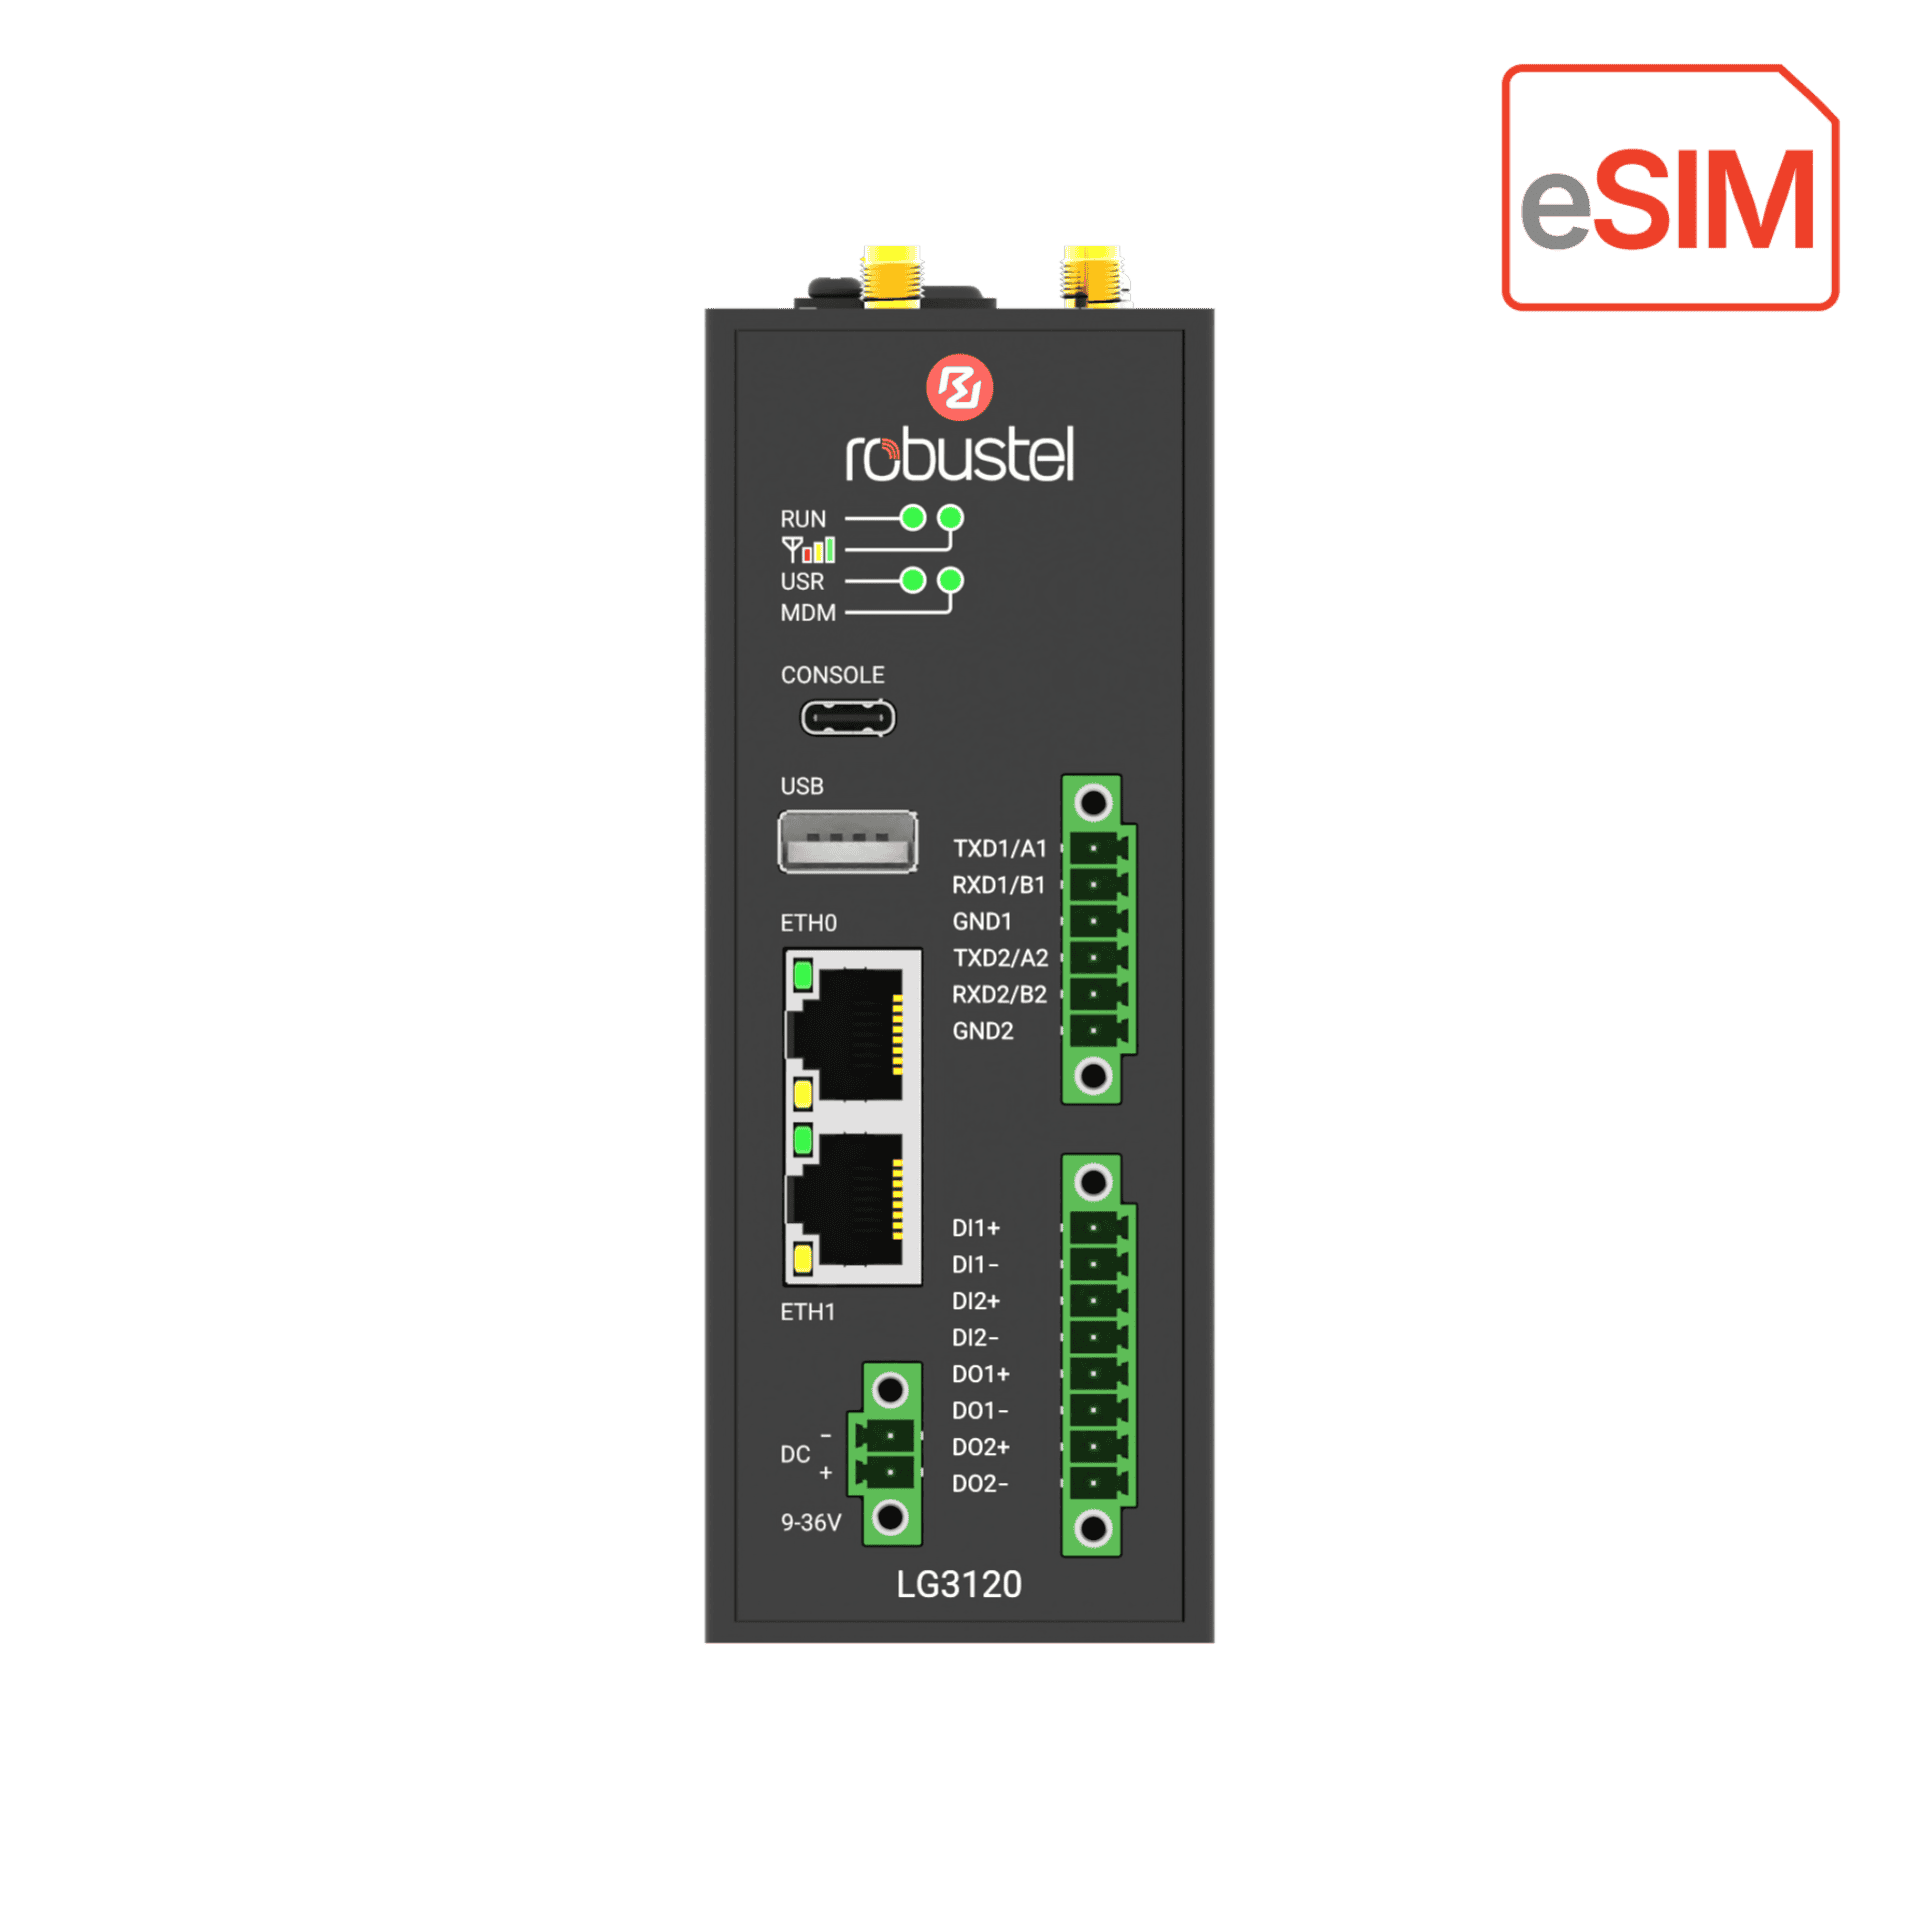 LG3120eBuilt-in network server
See what a sensor message actually means.
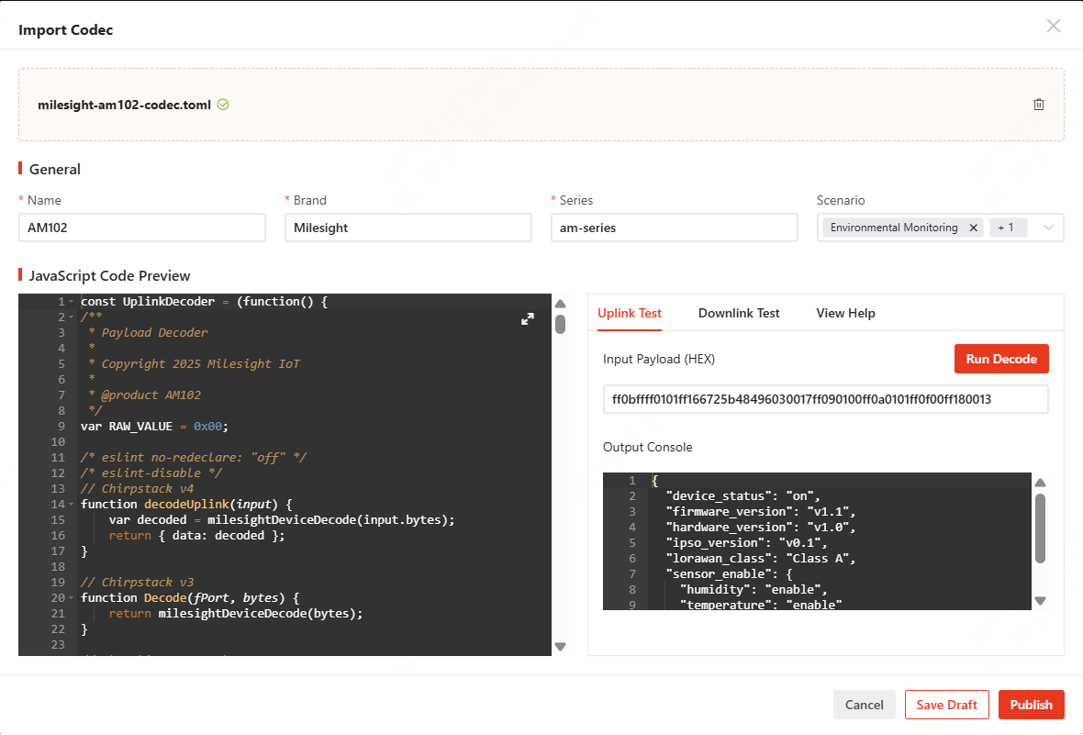
Test a sample payload with the codec for that sensor model. Compare the decoded values with the expected result, then check live uplinks when you connect your own device.
- Use a codec matched to the sensor model.
- Validate the field names and engineering units.
Turn raw readings into useful signals.
Apply scaling and offsets to express values in engineering units. Use Node-RED for a local workflow, or configure a scenario and a threshold alarm to flag a condition that needs attention.
- Evaluate a local condition from the scaled reading.
- Notify the operator when a threshold is exceeded.
235 × 0.1 = 23.5 °CRaw value × scale factor = temperatureCatch up after a connection drops.
If a cloud destination is unreachable, the gateway can buffer outgoing data within its configured capacity and retention period. After reconnection, send the oldest readings first for chronological replay, or the newest first for a current view.
- FIFO: send the oldest retained readings first.
- LIFO: send the newest retained readings first.
| Time | Reading |
|---|---|
| 10:00 | 23.4 °C |
| 10:01 | 23.5 °C |
| 10:02 | 23.6 °C |
Give site operators a local view with Pro.
Build a browser dashboard with live readings, trends and alarms. Built-in SCADA is available with the paid E2C Field Pro upgrade.
- Present live values, trends and alarm conditions.
- Built-in SCADA requires paid Pro Edition.
- Temperature
- 23.5 °C
- Humidity
- 46%
- Status
- Normal
Send field data where people already use it.
Publish selected tags to cloud services, or let building and industrial systems read them locally. Choose the destination and protocol for your application.
- Cloud publish: MQTT, HTTPS or Sparkplug B.
- Local servers: OPC UA, BACnet/IP or Modbus TCP.
Capabilities and capacity depend on the edition. Built-in SCADA requires the paid E2C Field Pro upgrade.
Field editions & capacity
- Free
- Full Field protocol support and up to 100 field tags.
- Core · Paid
- Full Field protocol support and up to 2,000 field tags for LoRaWAN and wired devices.
- Pro · Paid
- Adds built-in SCADA. Available with 2,000 or 5,000 field tags.
Stable operation at 5,000 tags requires 8 GB RAM. Ordinary alarm management is available in all editions; built-in SCADA is Pro-only.
RCMS
Remote fleet management
 From first connection to fleet operations
Deploy gateways with prepared configurations, monitor their health and maintain remote sites from one platform. Turn a successful evaluation into a repeatable rollout.
Give a new gateway a known configuration
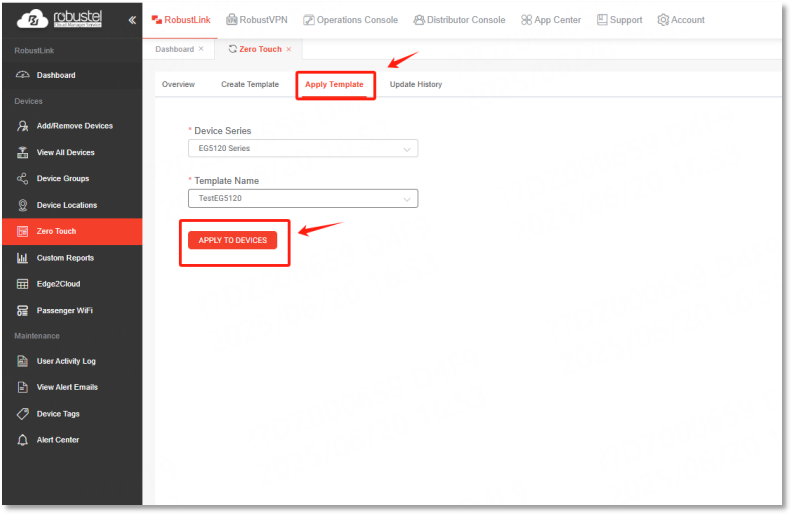
Prepare and assign a configuration template before sending a gateway to site. Once the registered gateway connects to the internet, it can receive its settings through RCMS.
- Choose a template for the target gateway.
- Associate the gateway with the intended deployment.
- Check its online status after first connection.
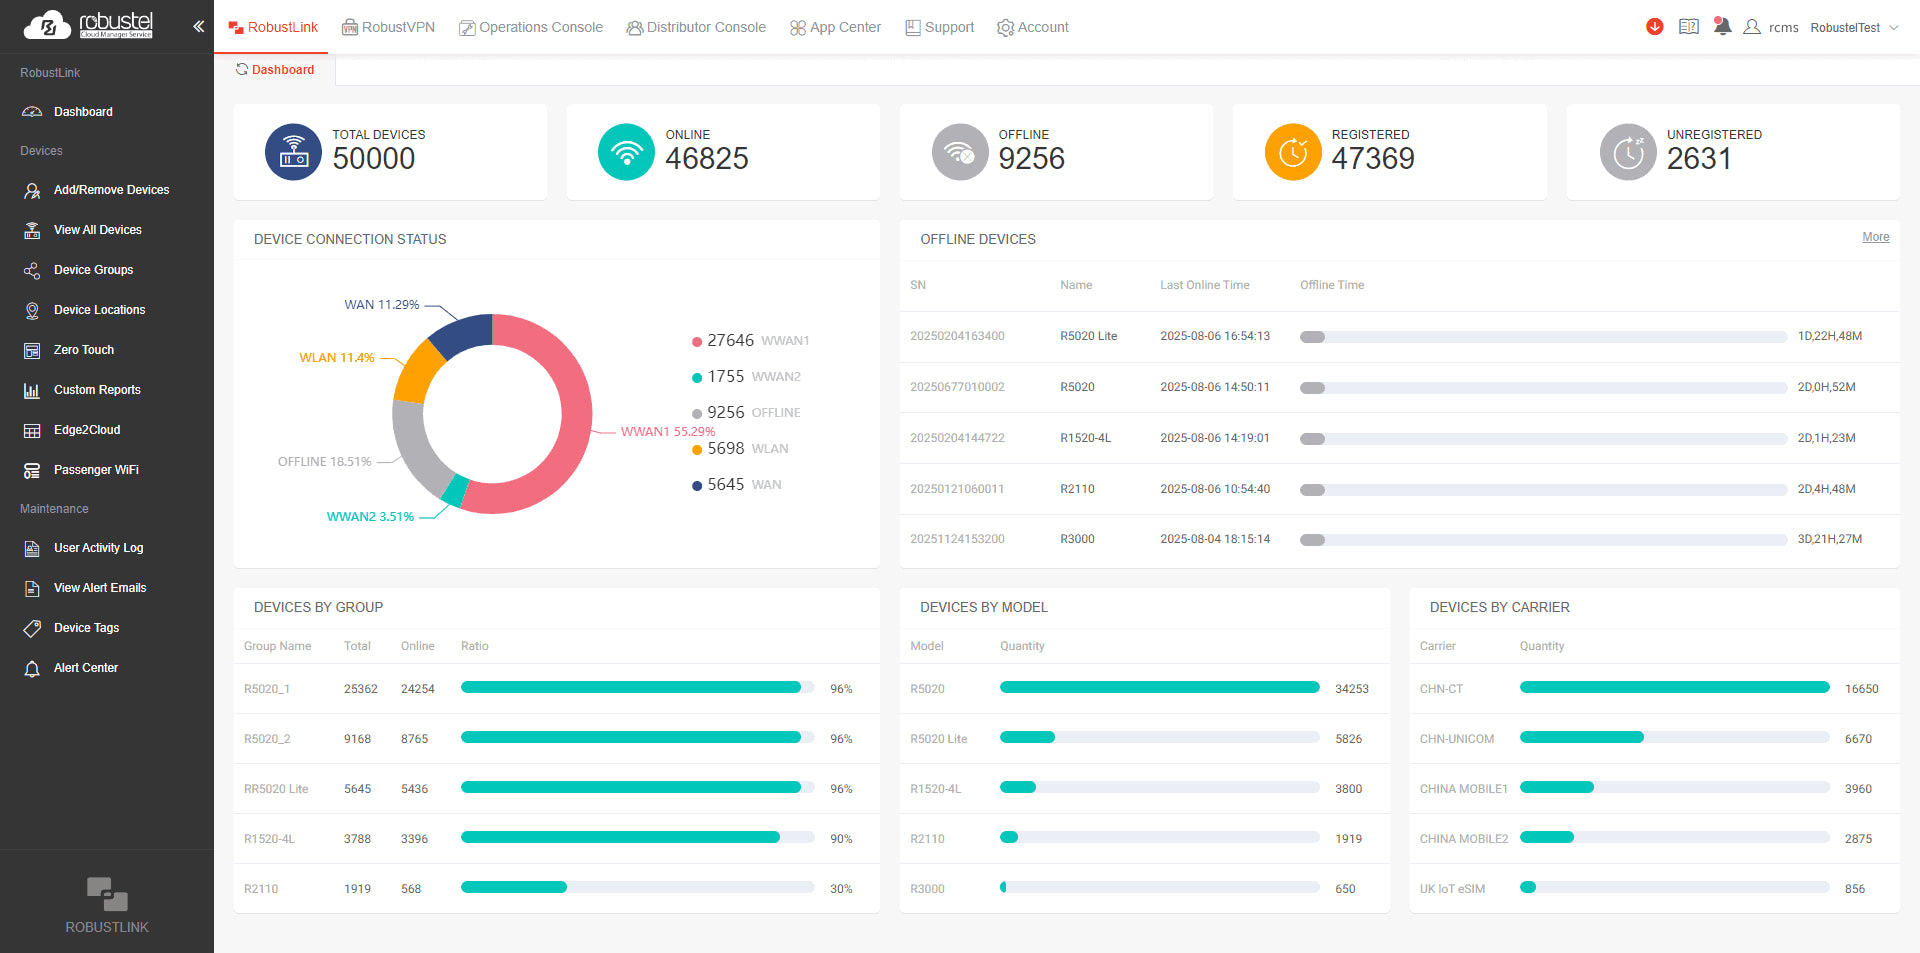
See which gateways are online
Start with the pilot gateway’s connection status. If a site goes offline, compare its connection history and cellular signal to see when the link changed. Use group views as more gateways come online.
- Check connection type and gateway information.
- Review signal strength and mobile data usage.
- Identify offline devices in a group.
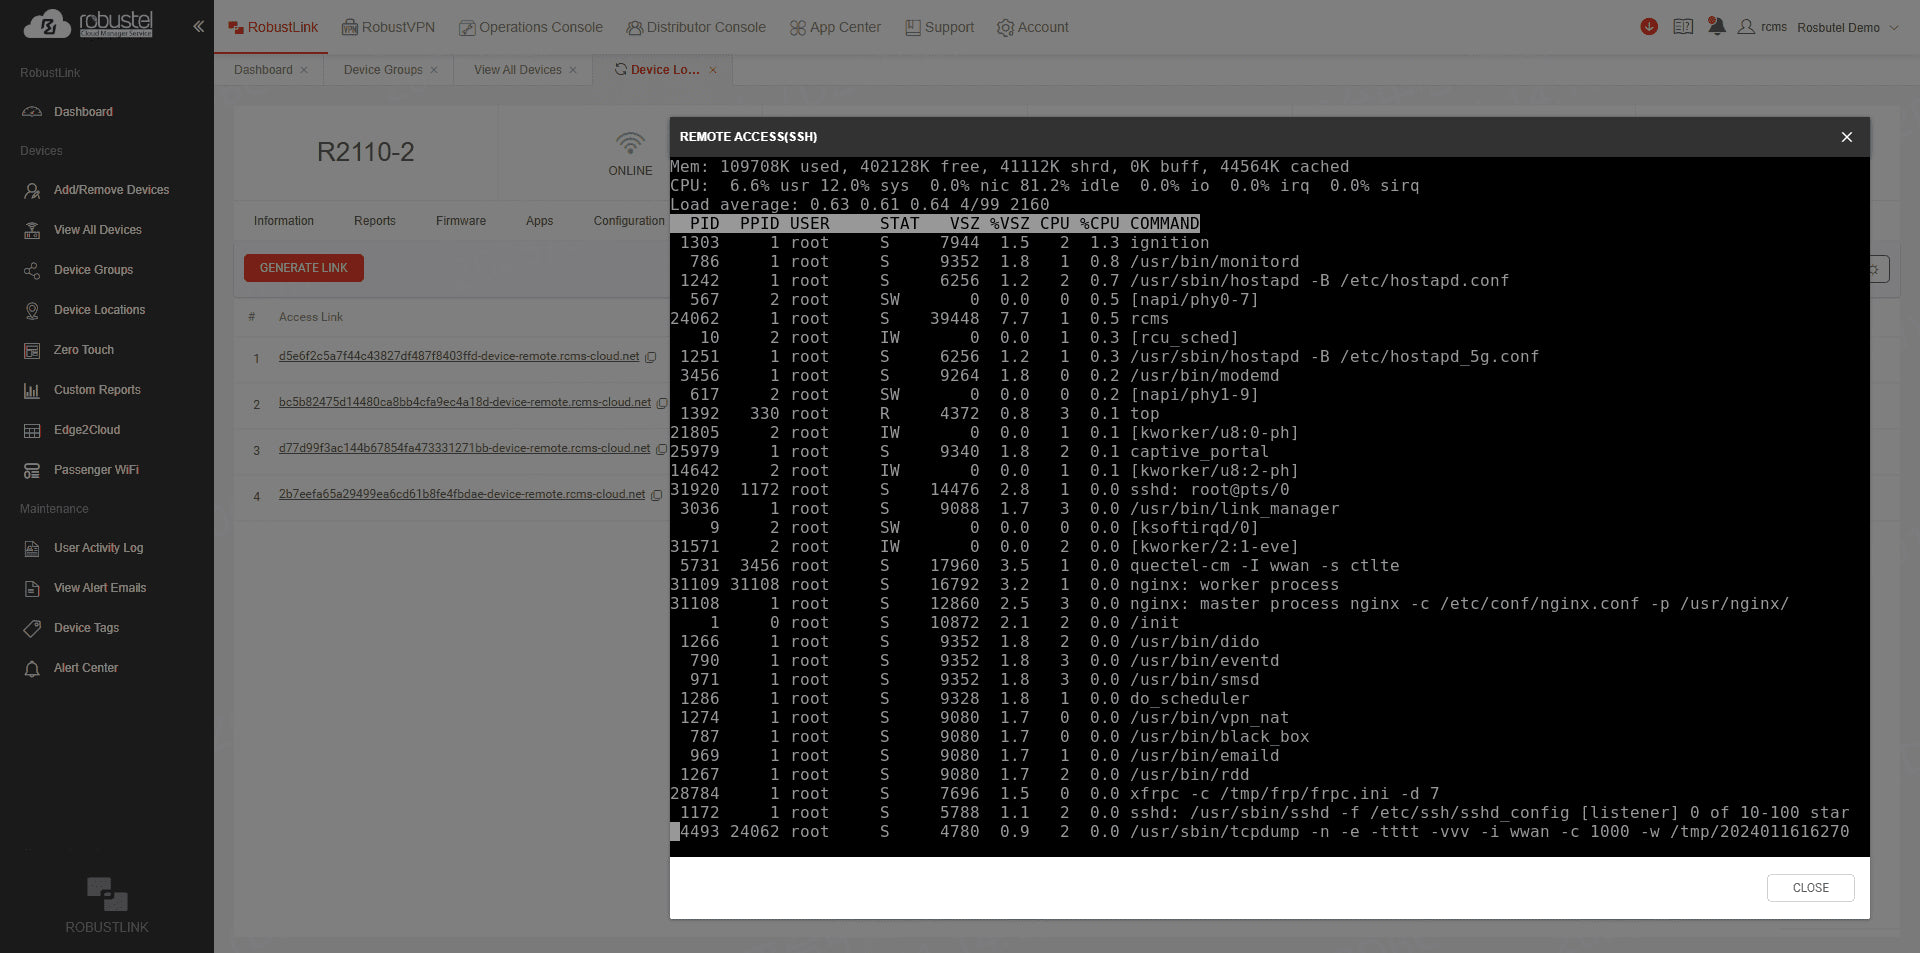
Reach the gateway or equipment at a remote site
Choose the connection for the job. To check gateway settings, open its management interface in a browser. To service equipment on the site network, use RobustVPN with the engineering tools you already use.
- Open the gateway’s web interface or a remote CLI session.
- Reach a PLC, HMI or camera behind the gateway over RobustVPN.
- Check that the gateway is online and the target device is reachable on its LAN.
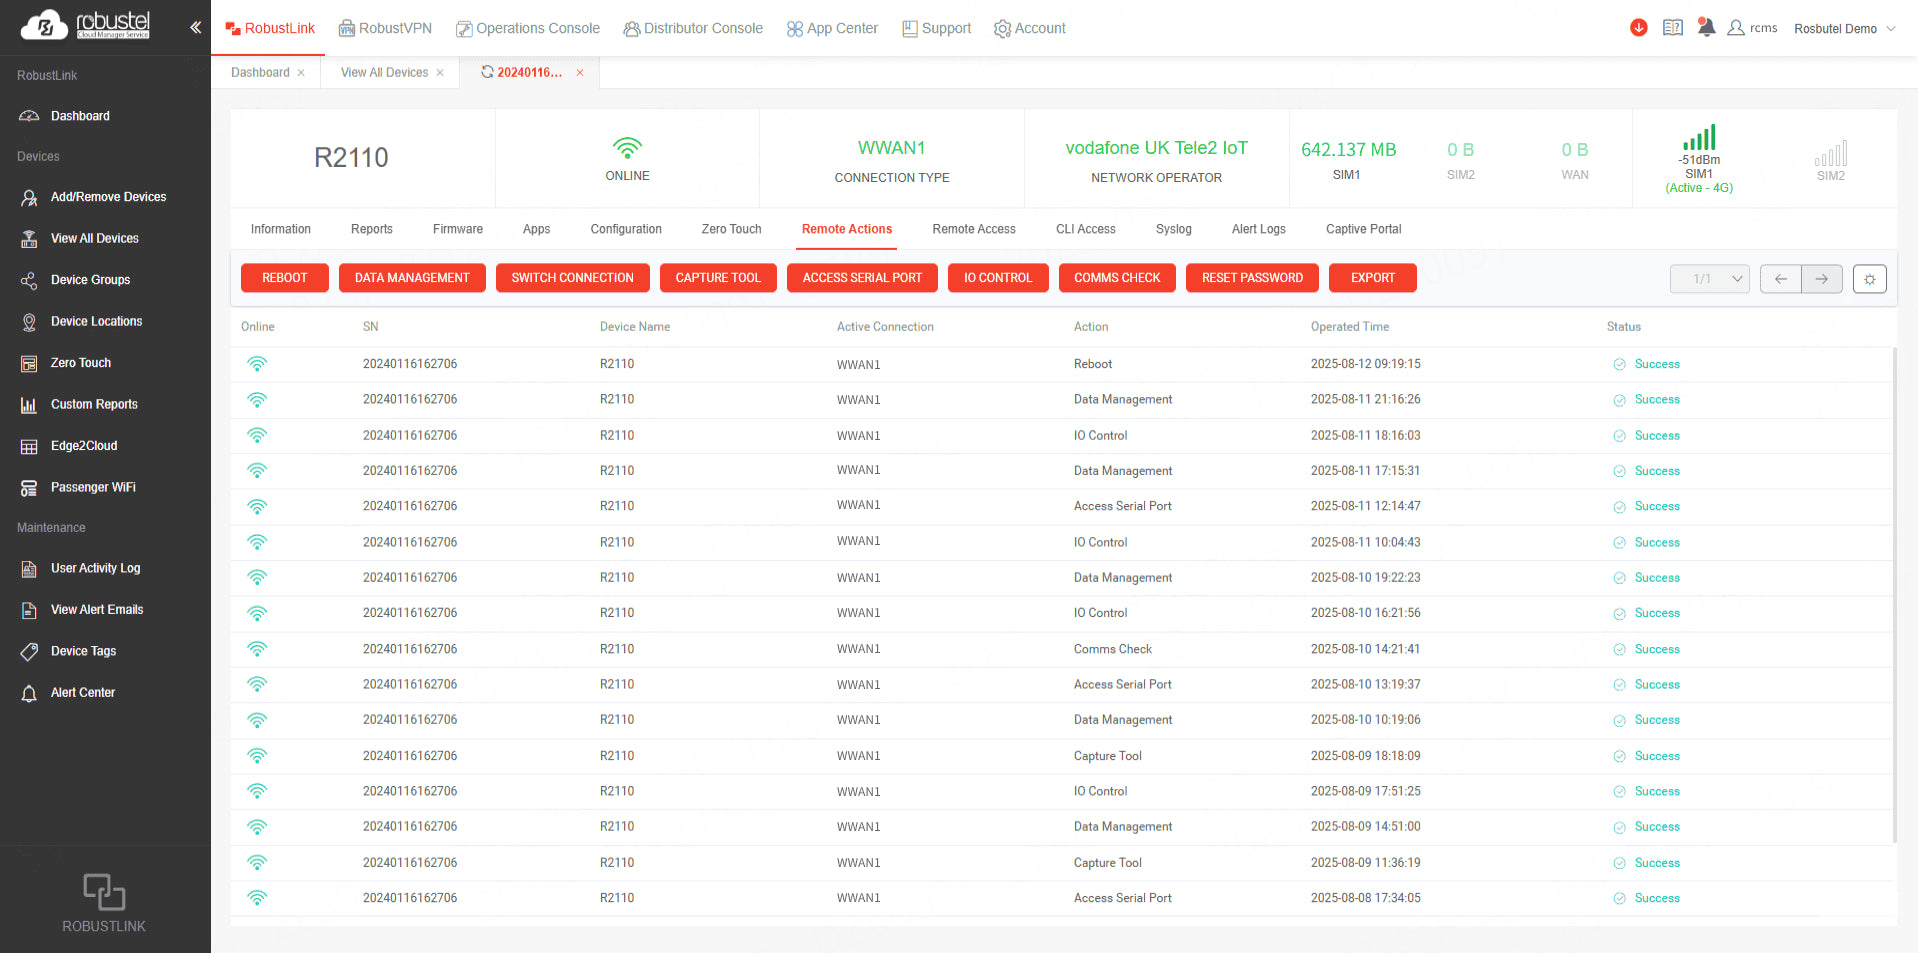
Diagnose faults and update selected gateways
Start an investigation with the gateway’s connection history and system log. When a configuration or firmware change is needed, target the affected gateways and review the update task in RCMS.
- Review or export the system log.
- Check the installed firmware version.
- Deliver configuration or firmware updates over the air.
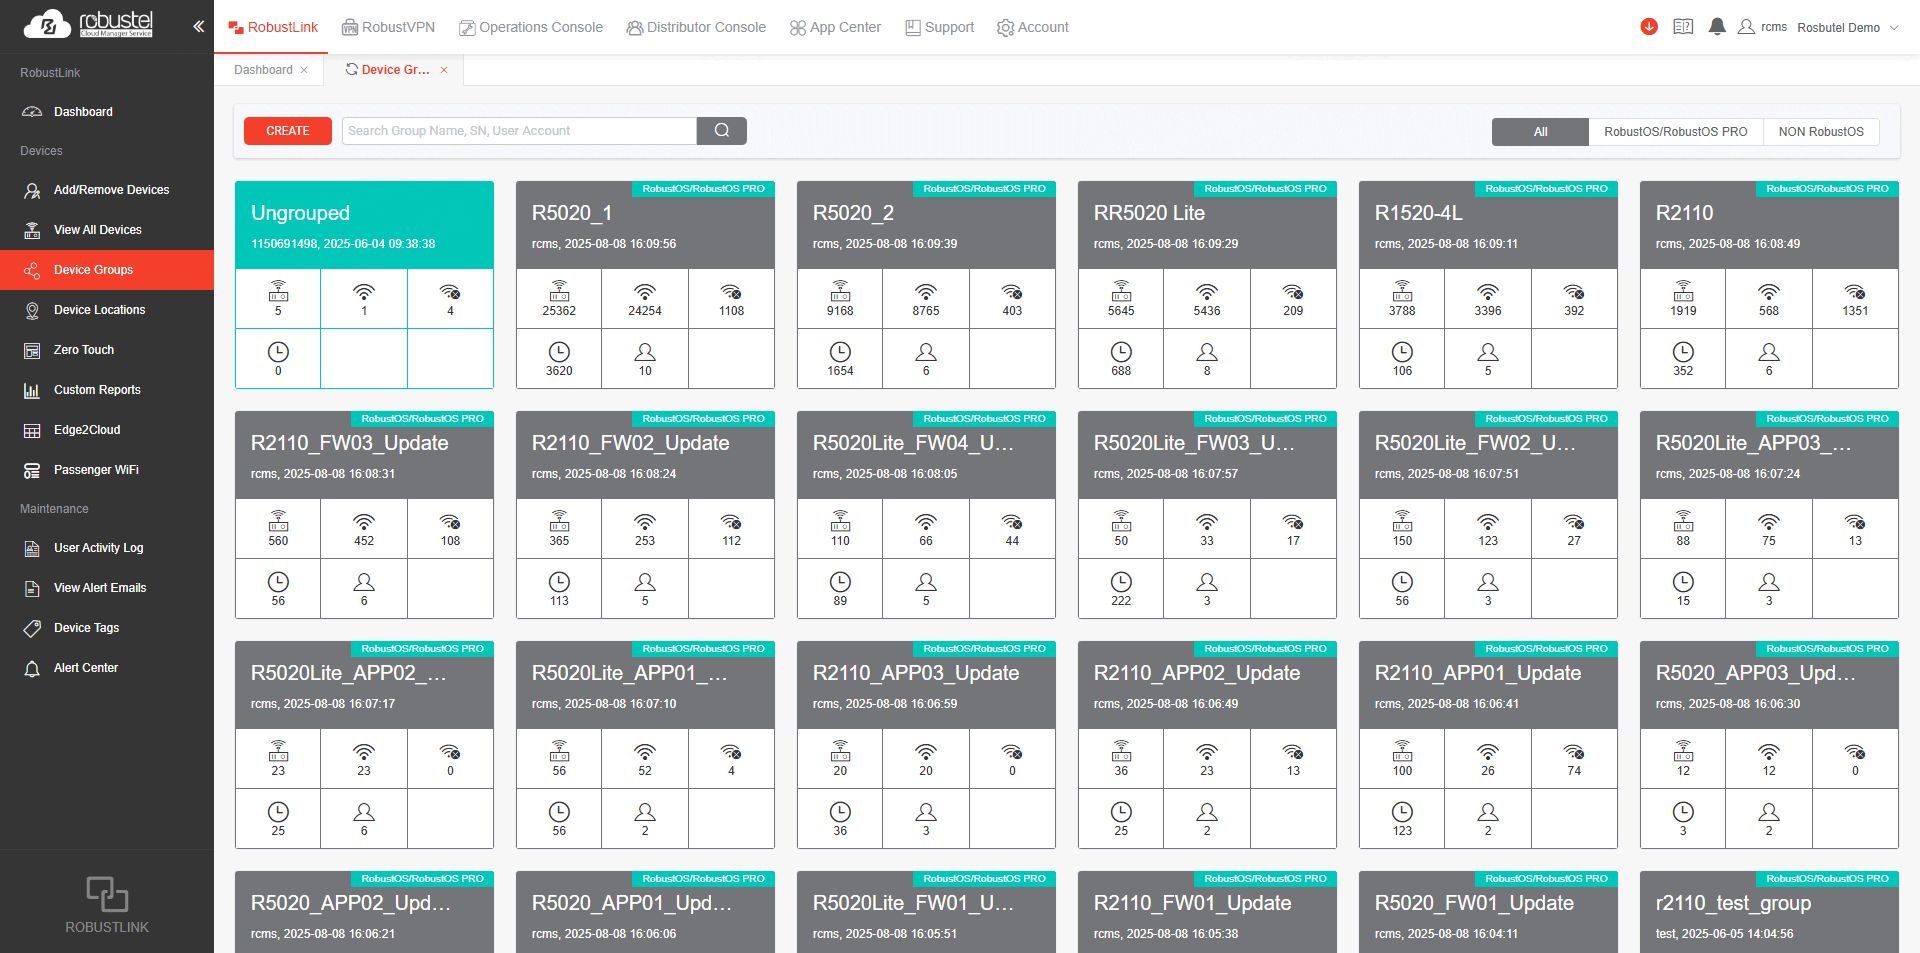
Take a validated pilot to the next group of sites
Reuse a validated pilot configuration for the next group of compatible gateways. Group devices by site or batch to see which have joined and which still need attention.
- Import a device list and review its status.
- Apply the validated template to the next batch.
- Track online and offline devices by group.
RCMS plans & access
- Basic · Free
- Gateway status, connection details, system logs and device groups.
- Essentials · Paid
- Adds zero-touch templates, remote configuration, firmware updates and gateway Web/CLI access.
- Advanced · Paid
- Includes Essentials, plus RobustVPN access to PLCs, HMIs and other downstream equipment.
Access depends on the device plan and user permissions. Remote access requires an authorised user.
Evaluate with a development Kit
Check the selected Kit for included licences, capacity, term and software validation status.
Industrial Data Kit
Perpetual E2C Factory Core with 2,000 collection and 2,000 SCADA tags; RCMS Advanced for 12 months, renewable.
Edge AI Vision Kit
Perpetual E2C Factory Core with 2,000 collection and 2,000 SCADA tags; RCMS Advanced for 12 months, renewable. AI integration and planned resources are still being tested.
LoRaWAN Integration Kit
Perpetual E2C Field Core with 2,000 field tags; RCMS Advanced for 12 months, renewable. Built-in SCADA requires an optional paid Pro upgrade.
Optional upgrades and third-party services are separate. The selected package identifies its supplied software, versions and service terms.