An example of generated RCMS reports showing a device's GPS location on a map and its recent connection log.

RobustLink - Report

Written by: Robert Liao

|

Published on

|

Time to read 5 min

Author: Robert Liao, Technical Support Engineer

Robert Liao is an IoT Technical Support Engineer at Robustel with hands-on experience in industrial networking and edge connectivity. Certified as a Networking Engineer, he specializes in helping customers deploy, configure, and troubleshoot IIoT solutions in real-world environments. In addition to delivering expert training and support, Robert provides tailored solutions based on customer needs—ensuring reliable, scalable, and efficient system performance across a wide range of industrial applications.

Summary

The RCMS report feature, a key tool within the RobustLink suite, acts as a powerful data Swiss Army Knife for your IoT deployment.

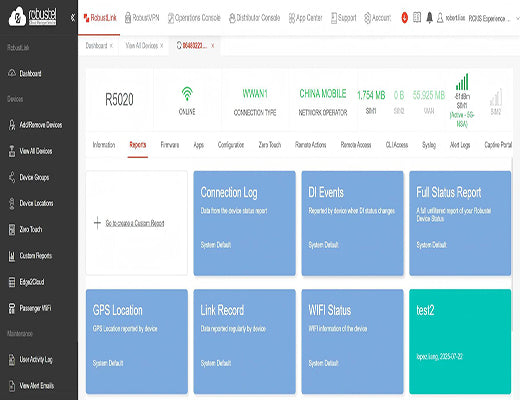
It allows you to quickly generate pre-configured reports for common tasks like checking connection logs or GPS history.

For deeper analysis, it offers the ability to build highly customized reports using up to three months of historical data, covering everything from system uptime and cellular signal to LAN status and CPU usage.

Introduction

In the world of IoT, data isn't just king—it's the entire kingdom. Managing a fleet of devices is one thing, but truly understanding their performance, health, and history is another. It's often the difference between preventing a costly failure and reacting to one. I’ve spoken with countless network engineers who feel like they're flying blind, drowning in alerts but starved for context.

This is where a robust management platform becomes indispensable. Think of our Robustel Cloud Manager Service (RCMS) as your multifunctional toolbox. Within RCMS, you'll find a powerful suite of remote access tools called RobustLink, and today we're pulling out one of its cornerstones: the RCMS report generator. Let's start with how you can get immediate insights in just a few clicks.

Master Your Data with the RCMS Report: A Deep Dive

Your Quick-Start Templates: Pre-Configured RCMS Reports

Let's be honest, sometimes you just need an answer, and you need it now. You don't always have time to build a complex query. For me, this is the most brilliant part of the design. RCMS anticipates your most common needs with a set of pre-configured reports that work right out of the box.

Think of them as your go-to presets for a quick health check or status update. These templates are a fantastic starting point and provide immediate value.

Here are a few of the most popular ones:

  • Connection Log: A chronological log of every connection change, including active link, uptime, IP address, and network provider. Perfect for tracking stability.
  • GPS Location: A log of timestamped latitude and longitude data for tracking your mobile assets.
  • Link Record: An incredibly detailed log of WAN and Cellular link performance, including TX/RX bytes, delay, CSQ, SINR, RSRQ, and RSRP. This is the holy grail for cellular network diagnostics.
  • DI Events: Timestamps for every Digital Input trigger—essential for monitoring connected sensors and machinery.
  • Full Status Report: The whole enchilada. An unfiltered dump of every available data point for a complete device audit.
  • WiFi Status: A simple list of clients connected to your router's WiFi, including their name, MAC, and IP address.

An example of generated RCMS reports showing a device's GPS location on a map and its recent connection log.


Crafting Your Own Story: The Power of Custom Reports

The pre-configured templates are fantastic, but what happens when you have a very specific question? What if you want to see if spikes in CPU usage are related to a drop in cellular signal quality?

This is where you graduate to the main event: the custom RCMS report builder. The true breakthrough for most engineers is realizing they are no longer limited to predefined views. You become a data detective, equipped to build a report that tells the exact story you need. The tool grants you access to the last three months of granular device data and gives you the power to pick and choose exactly what you want to see.

A user building a custom RCMS report by selecting data points like uptime and cellular status in the Robustel Cloud Manager Service interface.
Here's a look at the building blocks you have at your disposal:

Core System and Connectivity Metrics

These are the fundamentals—the vital signs of your device. In my experience, this is the starting point for 90% of all troubleshooting tasks.

  • System Status: Get a full snapshot including device model, uptime, RAM usage, firmware/hardware versions, and serial number.
  • Link Manager Status: See which link is active, its uptime, gateway IP, DNS servers, and current IP/netmask.
  • Cellular Status: This is a deep dive. You get modem model, current SIM, IMEI, ICCID, registration status, network type (e.g., 4G, 5G), band, PLMN ID, Cell ID, and signal quality metrics.
  • All LAN Interface Status: Monitor every LAN port with data on MTU, TX/RX packets and bytes, IP address, and MAC address.

Advanced Network and Hardware Insights

Ready to go deeper? These parameters help you understand network behavior and device load with incredible detail.

  • Route Table: See exactly how traffic is being routed, including the interface, destination, gateway, and metric.
  • Dynamic CPU Status: Keep an eye on processor load to ensure your device isn't being overworked.
  • WiFi (2.4GHz/5GHz) Status: For wireless models, you can track everything from AP frequency and mode to SSID, MAC address, channel, security mode, and the number of connected clients.
Infographic showcasing the various customizable data points available in an RCMS report, including system, cellular, link, and WiFi status.

Why This Data Is a Game-Changer for Your Operations

So, why is this so important? Because proactive management saves time, money, and headaches. With a powerful RCMS report, whether pre-configured or custom-built, you can:

  • Troubleshoot Faster: Pinpoint the root cause of issues using historical data instead of relying on real-time guesswork.
  • Optimize Performance: Identify underperforming devices or SIM cards and make data-backed decisions to improve your network.
  • Conduct Audits: Generate comprehensive reports for compliance, security audits, or performance reviews.

Ultimately, the RCMS report tool gives you the vision to manage your IoT deployment effectively, turning complex device fleets into well-understood, optimized networks.

Frequently Asked Questions (FAQ)

Q1: Where do I find the report feature in RCMS?

A1: The Report feature is located within the RobustLink section of your RCMS portal. RobustLink is the suite of tools that provides secure, remote access to your devices for tasks like CLI Access, Web GUI access, and generating reports.

Q2: How far back can I pull data for an RCMS report?

A2: You can access and generate reports based on the last three months of historical data for any device connected to your RCMS account. This provides a substantial window for trend analysis and troubleshooting past events.

Q3: Can I schedule reports to be run automatically?

A3: Yes! RCMS allows you to schedule reports—both pre-configured and custom ones— On the panel, you can select a custom start time and end time and generate a report for that time period.