
Processing Modbus Sensor Data at the Edge Using Node-RED on a Robustel IoT Gateway
|
|
Time to read 5 min
|
|
Time to read 5 min
This guide provides a practical, step-by-step walkthrough of how to use a Node-RED Modbus Gateway for powerful edge data processing. If you've ever struggled with how to get raw data from industrial sensors into a usable format, this article is for you.
We’ll show you how to use the low-code environment of Node-RED, running on a Robustel EG5120 industrial IoT edge gateway, to read data from a Modbus sensor, process it, and store it locally in an InfluxDB time-series database.
This guide is designed for automation engineers and IoT developers looking to build efficient and scalable data acquisition solutions with minimal coding.
I can't tell you how many times I've seen engineers get stuck on the same problem: they have a factory floor full of valuable sensors speaking Modbus, but all that data is trapped. Getting those raw, cryptic register values into a modern dashboard or cloud platform can feel like a complex coding project. But what if it didn't have to be?
What if you could visually drag-and-drop a few blocks to create a powerful data processing pipeline right at the edge? That's the magic of using Node-RED on a powerful Industrial IoT Edge Gateway . It transforms the gateway into a low-code, highly flexible Node-RED Modbus Gateway. In this guide, we’re not just going to talk theory; we're going to walk you through the exact steps to build this solution using a Robustel EG5120.

Before we can build our data flow, we need to make sure our industrial IoT edge gateway, the Robustel EG5120 , is ready. The power of this device comes from RobustOS Pro, its Debian-based OS, which allows us to easily install the software we need.
1. Access the EG5120 Web Interface: Log in to your gateway's management page (default IP: 192.168.0.1).
2. Navigate to the APP Center: Go to System -> APP Center.
3. Install the "MING" Stack: You will need to install the ming-ig application package, which includes support for InfluxDB and Grafana, and the node-red-app package. You can upload and install these
.deb or .rpk files directly from this interface.
4. Install the Extend Image (Insider Tip): This is a step many people miss. To get the full functionality and dependencies for these applications, you often need to first install an
extend-image patch for Debian. After installing this, it's a good practice to restore to factory default to ensure all new settings are applied correctly.
Once these are installed, you will see a new
Development tab in the main menu, giving you access to Node-RED, Data Storage (InfluxDB), and Data Visualization (Grafana).
Now for the fun part. We will build the flow that reads, processes, and stores our sensor data.
(Note: This section's structure is preserved for easy screenshot insertion.)
To accelerate development, you can start by importing a pre-built workflow.

Let's look at the key nodes in a typical Node-RED Modbus Gateway flow:
Once you click the Deploy button in the top right, your flow is live! You should see data appearing in the debug sidebar every second, confirming that your
Modbus data collection is successful.
Briefly, navigate to Development -> Data Storage in the EG5120's interface. Here, you can configure crucial settings for your InfluxDB database, such as setting a
Retention Time (e.g., 720 hours) to automatically delete old data and manage storage space.

You have just built a complete, industrial-grade data processing pipeline at the edge, all with minimal coding. By using a Node-RED Modbus Gateway like the Robustel EG5120, you've transformed the complex task of industrial data acquisition into a simple, visual workflow. This approach not only dramatically accelerates development but also empowers you to create highly customized and efficient IIoT applications.
What's next? Now that your data is flowing into InfluxDB, the next logical step is to visualize it. You can explore our guide on Creating Real-Time Dashboards for Your IoT Data with InfluxDB and Grafana .
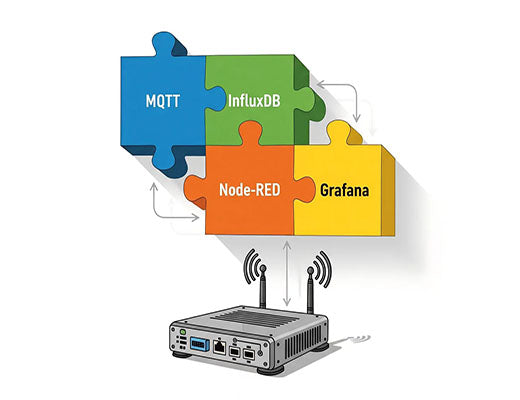
A1: MING is an acronym for a popular open-source IoT software stack: MQTT (for messaging), InfluxDB (for database), Node-RED (for logic), and Grafana (for visualization). An industrial IoT edge gateway that supports these tools provides a very powerful and flexible platform.
A2: For basic flows, no! Many tasks can be accomplished simply by wiring together pre-built nodes. For more advanced data transformation in a "Function" node, some basic JavaScript knowledge is helpful, but there are countless examples online to get you started.
A3: Absolutely. Instead of using the "InfluxDB Out" node, you would use an "MQTT Out" node to publish the data to any MQTT broker, whether it's on a local network or in a public cloud platform like AWS IoT – Industrial, Consumer, Commercial, Automotive – AWS .


